Brisbane Property Market Q3 2026: A Change of Pace After a Strong Run.
Brisbane home values eased over the September quarter but are still 5.9% higher than a year ago. This Brisbane property market update looks at what Cotality’s Q3 figures show, and what they could mean for your next move.
By Adam Empringham, Director of Sales
Published on October 27, 2026.
Last updated on October 27, 2026.
Brisbane finished the September quarter in a different spot from where it started.
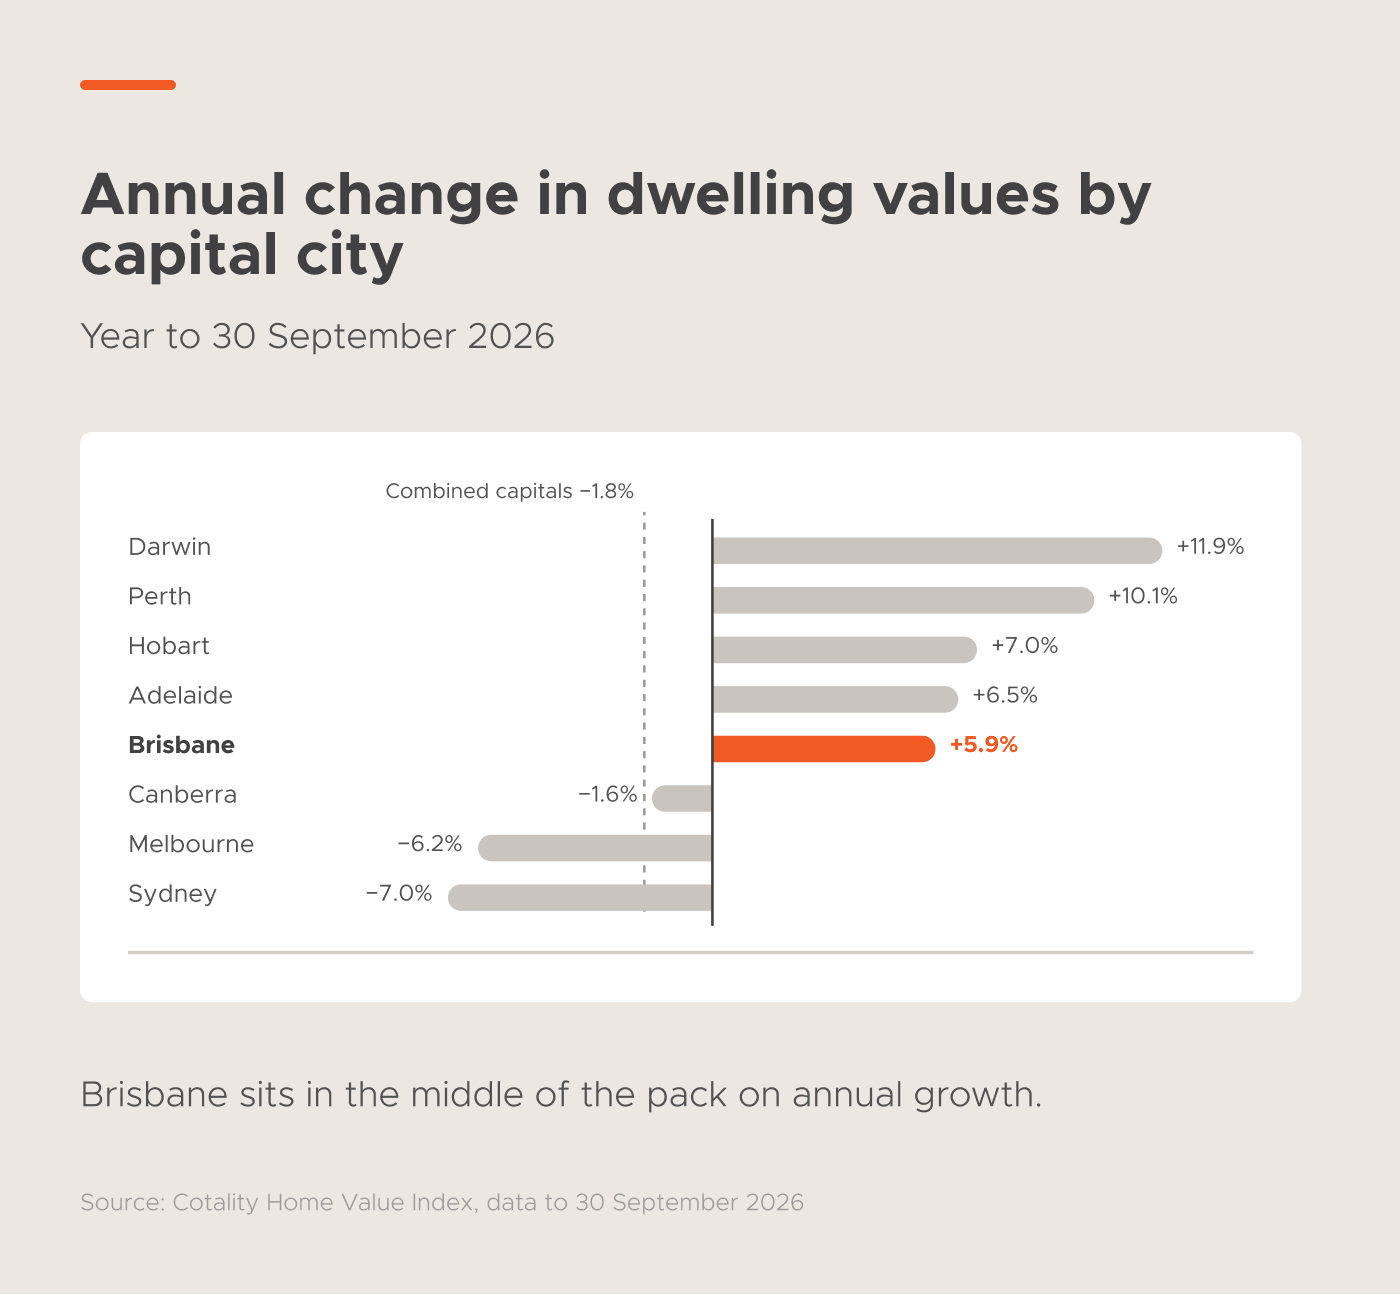
Home values eased 4.7% over the three months, but they’re still 5.9% higher than a year ago. Over the same 12 months, Sydney fell 7.0% and Melbourne fell 6.2%.
“We’ve worked through markets like this many times before. It’s been a while, so it can feel unfamiliar, but nothing about it is new. Buyers have more time and more choice, so the outcome comes down to strategy: how a home is priced, presented and positioned from day one.” Adam Empringham, Director of Sales at Image Property
The market has cooled, but over the longer term Brisbane is still ahead. Here’s what Cotality’s Q3 figures show and what they could mean for your next move.
Brisbane at a glance: September 2026.
| Dwellings | Houses | Units | |
|---|---|---|---|
| Median value | $1,048,880 | $1,146,078 | $834,627 |
| Quarterly change | −4.7% | −4.9% | −4.2% |
| Annual change | +5.9% | +5.3% | +8.5% |
| Gross rental yield | 3.5% | 3.4% | 4.2% |
Source: Cotality Home Value Index, data to 30 September 2026
How did the Brisbane property market perform in Q3 2026?
After several years of strong growth, Brisbane slowed noticeably through winter and into spring.
Values fell 1.5% in September, the largest monthly fall of any capital city that month. Brisbane is now 5.4% below its May 2026 peak.
Even so, the annual figure still shows growth. A home bought in September last year is, on average, worth more today.
Brisbane house prices vs unit prices: what’s the difference?
Units have held up better than houses this year.
The median unit value rose 8.5% over the year, compared with 5.3% for houses. Units also eased slightly less over the quarter.
The median unit is now just over $311,000 cheaper than the median house. Put another way, a buyer saving a 20% deposit would need around $62,000 less for the typical unit than for the typical house. With borrowing capacity tighter, that difference is drawing more buyers towards units and townhouses as a more achievable way into the market.
A quick note on terms: Cotality reports “median value”, not median sale price. It estimates what the typical home is worth across all homes, not only the ones that sold.
How does Brisbane compare to other capital cities?
| City | Quarter | Annual |
|---|---|---|
| Darwin | +0.5% | +11.9% |
| Perth | −4.7% | +10.1% |
| Hobart | −1.2% | +7.0% |
| Adelaide | −2.7% | +6.5% |
| Brisbane | −4.7% | +5.9% |
| Canberra | −3.2% | −1.6% |
| Melbourne | −3.4% | −6.2% |
| Sydney | −4.9% | −7.0% |
| Combined capitals | −4.3% | −1.8% |
Source: Cotality Home Value Index, data to 30 September 2026
Brisbane sits in the middle of the pack. It’s well ahead of Sydney and Melbourne, and behind Darwin, Perth, Hobart and Adelaide on annual growth.
It’s a good reminder that national headlines rarely describe your city, let alone your suburb. Even within Brisbane, Sherwood–Indooroopilly recorded annual growth of 10.7%, the strongest of any area in the city.
Find out instantly how the latest data affects your property price.
Get an instant market update, obligation-free.
What’s happening with Brisbane rents?
Rents are still rising, just more slowly than before.
Brisbane dwelling rents rose 1.3% over the September quarter, according to Cotality’s Quarterly Rental Review. Nationally, rents rose 0.5% over the quarter and 5.5% over the year.
Cotality’s Research Director, Tim Lawless, says rental growth “appears to have reached, or is close to, a ceiling”, as renters have less room in their budgets to absorb further increases.
For landlords, yields are improving. With values easing and rents still climbing, Brisbane’s gross yield sits at 3.4% for houses and 4.2% for units.
Why has the Brisbane market slowed?
A few things are working together:
- Higher interest rates. The RBA has lifted the cash rate to its highest level in 15 years, which reduces how much buyers can borrow.
- More choice for buyers. Total advertised listings in Brisbane are up 60.4% on a year ago.
- Homes taking longer to sell. The median time on market has stretched from 17 days to 38 days.
- Fewer sales. Brisbane sales over the past three months were 27.2% lower than a year earlier.
Put simply, buyers have more time and more options than they’ve had for years. That changes how homes need to be priced and marketed.
What should buyers and sellers in Brisbane consider now?
For buyers, there’s less pressure to rush. You have more time to compare, inspect and negotiate. Recent sales of similar homes in your target suburb will tell you more than any citywide average.
For sellers, presentation and pricing matter more than they did 12 months ago. Homes that are realistically priced and well marketed are still attracting genuine interest. Homes that miss the mark tend to sit longer. Getting a clear picture of local buyer demand before listing can save you time and second-guessing later.
For landlords, steady rental demand and stronger yields support long-term holding, especially for well-located units.
Key themes from Q3 2026.
- Growth has paused, not reversed. Values are down over the quarter and up over the year.
- Units are leading. They recorded stronger annual growth and higher yields than houses.
- Buyers have more choice. More listings and longer selling times have given buyers more room to negotiate.
- Rents are still rising, but at a slower pace.
- Local detail matters more than ever. Results vary widely between suburbs and property types.
What does this mean for your property?
Brisbane-wide figures give useful context, but they don’t tell the whole story of your home. Location, the property itself, recent sales nearby and local buyer demand all shape where your home sits in the market. If you’re planning a move, or just want to know where you stand, a conversation about your local area can make the next step much clearer. The Image Property team is here to help whenever you’re ready.
This article is for general information only and does not constitute financial or investment advice.
Table of Contents
- Brisbane at a glance: September 2026 01
- How did the Brisbane property market perform in Q3 2026? 02
- Brisbane house prices vs unit prices: what’s the difference? 03
- How does Brisbane compare to other capital cities? 04
- Find out instantly how the latest data affects your property price 05
- What’s happening with Brisbane rents? 06
- Why has the Brisbane market slowed? 07
- What should buyers and sellers in Brisbane consider now? 08
- Key themes from Q3 2026 09
- What does this mean for your property? 10
Agent Insight.
“We’ve worked through markets like this many times before. It’s been a while, so it can feel unfamiliar, but nothing about it is new. Buyers have more time and more choice, so the outcome comes down to strategy: how a home is priced, presented and positioned from day one.”

Adam Empringham
Director of Sales